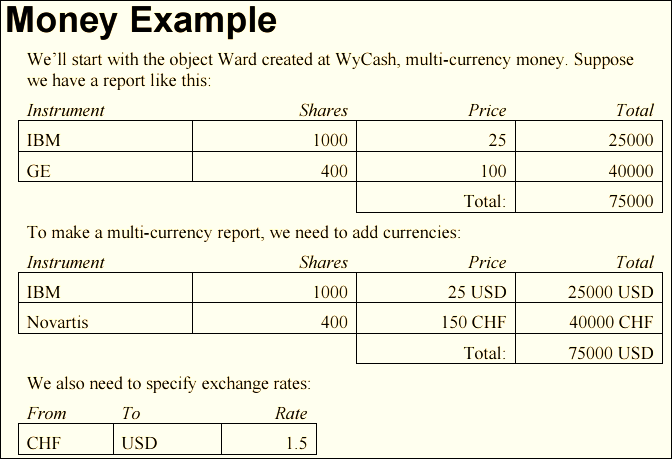
This is a follow up to my last post A Fistful of Dollars, where I looked at test-driven approaches to implementing a money type based on the example running through Kent Beck’s Test-Driven Development by Example book:

In this run I decided as an exercise to skip formal unit testing altogether and just script the functionality for the multi-currency report that Kent is working towards over 100 pages or so of his book:

Unsurprisingly It ended up being relatively quick and easy to implement.
Money type
First off we need a money type with an amount and a currency and support for multiplication and addition:
type Money = private { Amount:decimal; Currency:Currency }
   with
   static member ( * ) (lhs:Money,rhs:decimal) =
      { lhs with Amount=lhs.Amount * rhs }
   static member ( + ) (lhs:Money,rhs:Money) =
      if lhs.Currency <> rhs.Currency then invalidOp "Currency mismatch"
      { lhs with Amount=lhs.Amount + rhs.Amount}
   override money.ToString() = sprintf "%M%s" money.Amount money.Currency
and  Currency = string
In the code above I’ve used an F# record type with operator overloads for multiplication and addition.
Exchange rates
Next we need to be able to do currency conversion based on a rate table:
type RateTable = { To:Currency; From:Map<Currency,decimal> }

let exchangeRate (rates:RateTable) cy =
   if rates.To = cy then 1.0M else rates.From.[cy]

let convertCurrency (rates:RateTable) money =
   let rate = exchangeRate rates money.Currency
   { Amount=money.Amount / rate; Currency=rates.To }
Here I’ve used a record type for the table and simple functions to look up a rate and perform the conversion.
Report model
Now we need a representation for the input and output, i.e. the user’s positions and the report respectively:
type Report = { Rows:Row list; Total:Money }
and  Row = { Position:Position; Total:Money }
and  Position = { Instrument:string; Shares:int; Price:Money }
Again this is easily described using F# record types
Report generation
Here we need a function that takes the rates and positions and returns a report instance:
let generateReport rates positions =
   let rows =
      [for position in positions ->
         let total = position.Price * decimal position.Shares
         { Position=position; Total=total } ]
   let total =
      rows
      |> Seq.map (fun row -> convertCurrency rates row.Total)
      |> Seq.reduce (+)
   { Rows=rows; Total=total }
For the report generation I’ve used a simple projection to generate the rows followed by a map/reduce block to compute the total in the target currency.
Report view
There’s a number of different ways to view a generate the report. At first I looked at WinForms and WPF, which provide built-in data grids, but unfortunately I couldn’t find anything “simple” for showing summary rows.
In the end I plumped for a static HTML view with an embedded table:
let toHtml (report:Report) =
   html [
      head [ title %"Multi-currency report" ]
      body [
         table [
            "border"%="1"
            "style"%="border-collapse:collapse;"
            "cellpadding"%="8"
            thead [
               tr [th %"Instrument"; th %"Shares"; th %"Price"; th %"Total"]
            ]
            tbody [
               for row in report.Rows ->
                  let p = row.Position
                  tr [td %p.Instrument; td %p.Shares; td %p.Price; td %row.Total]
            ]
            tfoot [
               tr [td ("colspan"%="3"::"align"%="right"::[strong %"Total"])
                   td %report.Total]
            ]
         ]
      ]
   ]
For the HTML generation I wrote a small internal DSL for defining a page.
If you’re something a little more polished I found these static HTML DSLs on my travels:
Report data
Finally I can define the inputs and generate the report:
let USD amount = { Amount=amount; Currency="USD" }
let CHF amount = { Amount=amount; Currency="CHF" }

let positions =
   [{Instrument="IBM";      Shares=1000; Price=USD( 25M)}
    {Instrument="Novartis"; Shares= 400; Price=CHF(150M)}]

let inUSD = { To="USD"; From=Map.ofList ["CHF",1.5M] }

let positionsInUSD = generateReport inUSD positions

let report = positionsInUSD |> toHtml |> Html.toString
Which I think is pretty self-explanatory.
Report table
The resultant HTML appears to match the table from the book pretty well:
| Instrument |
Shares |
Price |
Total |
| IBM |
1000 |
25USD |
25000USD |
| Novartis |
400 |
150CHF |
60000CHF |
| Total |
65000USD |
Summary
I was able to implement the report in small steps using F# interactive to get quick feedback and test out scenarios, with the final result being as expected on first time of running.
Overall I’m pretty happy with the brevity of the implementation. F# made light work of generating the report, and statically generated HTML produced a nice result with minimal effort, a technique I’ll be tempted to repeat in the future.
The full script is available as an F# Snippet.